Stimulus timing
経済刺激策のタイミング
One thing that often becomes clear when we talk about prospects for next year — which worry me — is that there’s a lot of confusion over the timing of stimulus impacts. Even well-informed people will say things like “we’ve only spent a quarter of the money, so let’s wait and see what happens.” Menzie Chinn tried to get at this confusion recently; here’s my take.
来年の見通しについて話す時に、ある1つのことがはっきりしている。私も心配していることで、経済刺激策のタイミングでの大混乱である。 情報通の人でさえ、”我々はすでに4分の1の資金を使ったので、どうなるか見守ろう”と言っている。メンジー・チン教授は、最近のこの混乱を解説しようとしていた。 これが、私の見解である。
Let me work with a stylized numerical example. It doesn’t quite match the real stimulus — there’s no distinction between spending and tax cuts, and it tails off much faster than the real thing. But I think it’s close enough to make the point. Here’s the table:
図式化された数値データを使って説明させてくれ。実際の経済刺激策とは、全然一致していない。消費と減税との区分けがないので、実際の数値より早く切り捨ててしまっているからだ。ただ、これでも十分私の見解を主張することができる。以下がテーブルである。
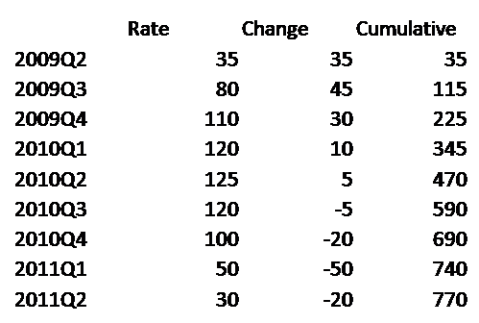
In the table, “Rate” is the total stimulus spending within each quarter. “Change” is the change in stimulus spending from the previous quarter. And “Cumulative is the total spending to date.
“Rate” その四半期の中での経済刺激策の総消費値。
“Change” 前四半期からの経済刺激策の消費量の変化値。
“Cumulative ” 総消費値。
Now think about three questions you might ask. The first is, how much higher is GDP this quarter than it would be without the stimulus? This should depend on “Rate” — on the quantity of goods and services the government is buying right now.
今、質問されるだろう3つのことが思い浮かぶ。
まず第1に、経済刺激策がなかったら、今四半期はGDPはどれほどだろうか?
これは政府が現在購入している商品とサービスの数値である、“Rate”から推測できる。
The second question is, how much faster is GDP growth this quarter than it would be without the stimulus? This should depend on “Change” — on the extent to which the government is buying more stuff than it did last quarter.
第2の質問は、経済刺激策がなかったら、今四半期のGDP成長率ははどれほどだろうか?
これは政府が前四半期に購入してから、今期購入しているモノの数値である、“Change”から推測できる。
Finally, you can ask, how much of the stimulus money has been spent? For that you want to look at “Cumulative”, and compare it with the final total for that column.
最後の質問は、経済刺激策はお金をどこまで使っているのか?
“Cumulative”をみれば分かる。 このコラムで、現時点の総額と最終総額を比較しておく。
Now the point is that “Rate”, in real life, follows an inverted U. The peak effect on the level of GDP comes at the top of the curve, but the peak effect on growth comes earlier, before the curve flattens out. In the table above, spending peaks in the second quarter of 2010, but the peak impact on growth is in the third quarter of 2009, i.e., it’s behind us. That’s true even though by the end of 2009 less than a third of the money has been spent.
実生活では、“Rate”(消費量)は、逆U字型になることが重要である。そのピークは、GDPがカーブの頂点に達する時期に影響するが、カーブが平らになる前に、そのGDP成長のピークは過ぎてしまった。上のテーブルでは、経済刺激策の消費ピークは、2010年第2四半期になっているが、そのGDP成長へのインパクトは、2009年の第3四半期である。つまり、もう過ぎてしまったということだ。
また、2009年第3四半期までに資金の3分の1は、使い果たしてしまったことも事実である。
And when the spending begins to tail off, the effect on growth turns negative.
経済刺激策が尽きたら、GDP成長への効果は後退するだろう。
What does this really look like? Menzie gives us the chart from Deutsche Bank, which is similar to other estimates, e.g. from Goldman Sachs:
このことを本当にどう思う? ドイツバンクのリサーチによるチャートでも指し示している。
同じような予測は、例えばゴールドマン・サックスなどでもしている。

You can see why I and many others are worried about the second half of next year.
なぜ、私も含め多くの人が来年の後半を心配しているか分かるでしょ。

0 件のコメント:
コメントを投稿