January 8, 2010, 11:51 am
Payrolls and paradigms
雇用者とパラダイム
Disappointing job number this morning. Still, a month is just a month, right? Well, not quite.
今朝の雇用数値にはがっかりしたよ。ただ、1ヶ月は単なる1ヶ月のデータなんじゃないの?。そうじゃないよ。
Here’s the way I think about the economic news: each piece of data tells us something about which model of recovery is right. More specifically, each disappointing piece of data strengthens the case of the pessimists.
私は経済ニュースを以下のように考えている。
細かな数値は、経済の回復モデルが正しいかどうか判断をするものである。もっと具体的に言うと、悲観的なデータにより悲観主義者の唱えるケースが強まったと言うことだ。
From the beginning, there have been two schools of thought about the likely path of recovery. One school — strongly represented among Wall Street economists — said that the 2008-2009 recession should be compared with other deep US recessions: 1957 (the “Edsel” recession), 1974-5, 1981-2. These recessions were followed by rapid, V-shaped recoveries.
最初から、景気回復が起こりえる道筋には2つの考え方があった。1つは、ウォールストリートのエコノミスト達が強く思い描いているような、2008-2009の景気後退も、過去のアメリカの深刻なリセッションと同じように考えるべきだというもの。つまり、1957年(物が売れなかった時代)、1974-5年、1981-2年。これらの景気後退は、急激なV字回復をした。
The other school of thought said that this was a postmodern recession, very different in character from those prior deep recessions, and that it was likely to be followed by a prolonged “jobless recovery”. Added to that were worries based on the historical aftermath of financial crises, which tends to be prolonged and ugly.
もう1方の考えは、今回はポストモダン時代の景気後退であり、過去の景気後退とは性質が、かなり違い、雇用の非創出が長引くことで、ずるずると行くというものだ。さらに付け加えると、金融危機の爪痕を過去の歴史にもとづいて心配されることは、長期的であり、面倒であることだ。
The debate a year ago over the size of stimulus was in part an implicit debate between these two views; those who argued that the stimulus was much too small did so because they had a pessimistic view about the likely pace of recovery.
景気刺激策の規模に関する、1年前の議論では、ある意味、これら2つの見方での暗黙的議論であった。 景気回復の速度に関して悲観的な意見を持っていたから、景気刺激策が小さすぎると主張していた人達は、あのように主張していたのだ。
Sad to say, each successive bad jobs report adds to the evidence that the pessimists were right.
残念なことに、この一連の雇用レポートの悲惨な結果が悲観主義者が正しかったという証拠付けになっている。
他の景気指数が回復しているのに、失業率だけは10%横ばいを続けているのを見ると、悲観主義者(クルーグマン)が正しかったようですね。

1228 Age of diminished expectations
December 28, 2009, 8:53 am
Age of diminished expectations
期待が減退した時代
“Economy poised for surge as most accurate economist see U.S.” reads the Bloomberg headline. So it’s a major disappointment to read what Bloomberg considers a “surge”: 3.5 percent growth in 2010.
ブルームバーグヘッドラインを読むと、ほとんどの緻密なエコノミスト達がアメリカを見て、経済が急回復する構えを見せていると。ブルームバーグが急回復と見なしているものは、2010年の3.5%の成長率なので、ほんとガッカリするよ。
Um, that’s really subpar for recoveries, let alone recoveries from deep slumps:
それじゃ、本当に景気回復と呼べる代物じゃないよ、長いスランプからちょっと回復しただけだよ。

Or put it this way: during the Clinton years — a 8-year stretch — the average rate of growth was 3.7 percent. Growth at the pace Dean Maki predicts should be enough to bring unemployment down — but not by much. And his prediction is “among the highest” among 58 economists.
もしくは、以下のようにも言うことができる。
クリントン時代の8期では、平均成長率は3.7%であった。 ディエン・マッキ(バークレーズ銀行)の予測する3.5%の成長率で、十分ではないが、失業を抑えることができると。ただ、彼の予測は58人のエコノミストの中だけの話。
I hope he’s right, although my money is still on the more downbeat views of the Goldman guys. Still, it’s amazing how we’ve defined economic success down.
彼の主張が正しいことを祈るよ。ただ、私の資金は、ゴールドマンサックスの主張である景気後退に賭けておくけど・・。けれども、自分たちで経済成長を低く定義し直すなんて、ありえないよ。
Age of diminished expectations
期待が減退した時代
“Economy poised for surge as most accurate economist see U.S.” reads the Bloomberg headline. So it’s a major disappointment to read what Bloomberg considers a “surge”: 3.5 percent growth in 2010.
ブルームバーグヘッドラインを読むと、ほとんどの緻密なエコノミスト達がアメリカを見て、経済が急回復する構えを見せていると。ブルームバーグが急回復と見なしているものは、2010年の3.5%の成長率なので、ほんとガッカリするよ。
Um, that’s really subpar for recoveries, let alone recoveries from deep slumps:
それじゃ、本当に景気回復と呼べる代物じゃないよ、長いスランプからちょっと回復しただけだよ。

Or put it this way: during the Clinton years — a 8-year stretch — the average rate of growth was 3.7 percent. Growth at the pace Dean Maki predicts should be enough to bring unemployment down — but not by much. And his prediction is “among the highest” among 58 economists.
もしくは、以下のようにも言うことができる。
クリントン時代の8期では、平均成長率は3.7%であった。 ディエン・マッキ(バークレーズ銀行)の予測する3.5%の成長率で、十分ではないが、失業を抑えることができると。ただ、彼の予測は58人のエコノミストの中だけの話。
I hope he’s right, although my money is still on the more downbeat views of the Goldman guys. Still, it’s amazing how we’ve defined economic success down.
彼の主張が正しいことを祈るよ。ただ、私の資金は、ゴールドマンサックスの主張である景気後退に賭けておくけど・・。けれども、自分たちで経済成長を低く定義し直すなんて、ありえないよ。
1227 Stimulus timing
December 27, 2009, 5:19 pm
Stimulus timing
経済刺激策のタイミング
One thing that often becomes clear when we talk about prospects for next year — which worry me — is that there’s a lot of confusion over the timing of stimulus impacts. Even well-informed people will say things like “we’ve only spent a quarter of the money, so let’s wait and see what happens.” Menzie Chinn tried to get at this confusion recently; here’s my take.
来年の見通しについて話す時に、ある1つのことがはっきりしている。私も心配していることで、経済刺激策のタイミングでの大混乱である。 情報通の人でさえ、”我々はすでに4分の1の資金を使ったので、どうなるか見守ろう”と言っている。メンジー・チン教授は、最近のこの混乱を解説しようとしていた。 これが、私の見解である。
Let me work with a stylized numerical example. It doesn’t quite match the real stimulus — there’s no distinction between spending and tax cuts, and it tails off much faster than the real thing. But I think it’s close enough to make the point. Here’s the table:
図式化された数値データを使って説明させてくれ。実際の経済刺激策とは、全然一致していない。消費と減税との区分けがないので、実際の数値より早く切り捨ててしまっているからだ。ただ、これでも十分私の見解を主張することができる。以下がテーブルである。

In the table, “Rate” is the total stimulus spending within each quarter. “Change” is the change in stimulus spending from the previous quarter. And “Cumulative is the total spending to date.
“Rate” その四半期の中での経済刺激策の総消費値。
“Change” 前四半期からの経済刺激策の消費量の変化値。
“Cumulative ” 総消費値。
Now think about three questions you might ask. The first is, how much higher is GDP this quarter than it would be without the stimulus? This should depend on “Rate” — on the quantity of goods and services the government is buying right now.
今、質問されるだろう3つのことが思い浮かぶ。
まず第1に、経済刺激策がなかったら、今四半期はGDPはどれほどだろうか?
これは政府が現在購入している商品とサービスの数値である、“Rate”から推測できる。
The second question is, how much faster is GDP growth this quarter than it would be without the stimulus? This should depend on “Change” — on the extent to which the government is buying more stuff than it did last quarter.
第2の質問は、経済刺激策がなかったら、今四半期のGDP成長率ははどれほどだろうか?
これは政府が前四半期に購入してから、今期購入しているモノの数値である、“Change”から推測できる。
Finally, you can ask, how much of the stimulus money has been spent? For that you want to look at “Cumulative”, and compare it with the final total for that column.
最後の質問は、経済刺激策はお金をどこまで使っているのか?
“Cumulative”をみれば分かる。 このコラムで、現時点の総額と最終総額を比較しておく。
Now the point is that “Rate”, in real life, follows an inverted U. The peak effect on the level of GDP comes at the top of the curve, but the peak effect on growth comes earlier, before the curve flattens out. In the table above, spending peaks in the second quarter of 2010, but the peak impact on growth is in the third quarter of 2009, i.e., it’s behind us. That’s true even though by the end of 2009 less than a third of the money has been spent.
実生活では、“Rate”(消費量)は、逆U字型になることが重要である。そのピークは、GDPがカーブの頂点に達する時期に影響するが、カーブが平らになる前に、そのGDP成長のピークは過ぎてしまった。上のテーブルでは、経済刺激策の消費ピークは、2010年第2四半期になっているが、そのGDP成長へのインパクトは、2009年の第3四半期である。つまり、もう過ぎてしまったということだ。
また、2009年第3四半期までに資金の3分の1は、使い果たしてしまったことも事実である。
And when the spending begins to tail off, the effect on growth turns negative.
経済刺激策が尽きたら、GDP成長への効果は後退するだろう。
What does this really look like? Menzie gives us the chart from Deutsche Bank, which is similar to other estimates, e.g. from Goldman Sachs:
このことを本当にどう思う? ドイツバンクのリサーチによるチャートでも指し示している。
同じような予測は、例えばゴールドマン・サックスなどでもしている。

You can see why I and many others are worried about the second half of next year.
なぜ、私も含め多くの人が来年の後半を心配しているか分かるでしょ。
Stimulus timing
経済刺激策のタイミング
One thing that often becomes clear when we talk about prospects for next year — which worry me — is that there’s a lot of confusion over the timing of stimulus impacts. Even well-informed people will say things like “we’ve only spent a quarter of the money, so let’s wait and see what happens.” Menzie Chinn tried to get at this confusion recently; here’s my take.
来年の見通しについて話す時に、ある1つのことがはっきりしている。私も心配していることで、経済刺激策のタイミングでの大混乱である。 情報通の人でさえ、”我々はすでに4分の1の資金を使ったので、どうなるか見守ろう”と言っている。メンジー・チン教授は、最近のこの混乱を解説しようとしていた。 これが、私の見解である。
Let me work with a stylized numerical example. It doesn’t quite match the real stimulus — there’s no distinction between spending and tax cuts, and it tails off much faster than the real thing. But I think it’s close enough to make the point. Here’s the table:
図式化された数値データを使って説明させてくれ。実際の経済刺激策とは、全然一致していない。消費と減税との区分けがないので、実際の数値より早く切り捨ててしまっているからだ。ただ、これでも十分私の見解を主張することができる。以下がテーブルである。
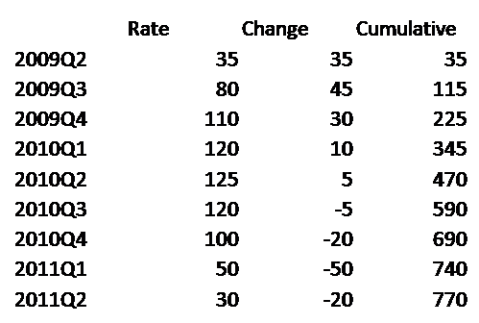
In the table, “Rate” is the total stimulus spending within each quarter. “Change” is the change in stimulus spending from the previous quarter. And “Cumulative is the total spending to date.
“Rate” その四半期の中での経済刺激策の総消費値。
“Change” 前四半期からの経済刺激策の消費量の変化値。
“Cumulative ” 総消費値。
Now think about three questions you might ask. The first is, how much higher is GDP this quarter than it would be without the stimulus? This should depend on “Rate” — on the quantity of goods and services the government is buying right now.
今、質問されるだろう3つのことが思い浮かぶ。
まず第1に、経済刺激策がなかったら、今四半期はGDPはどれほどだろうか?
これは政府が現在購入している商品とサービスの数値である、“Rate”から推測できる。
The second question is, how much faster is GDP growth this quarter than it would be without the stimulus? This should depend on “Change” — on the extent to which the government is buying more stuff than it did last quarter.
第2の質問は、経済刺激策がなかったら、今四半期のGDP成長率ははどれほどだろうか?
これは政府が前四半期に購入してから、今期購入しているモノの数値である、“Change”から推測できる。
Finally, you can ask, how much of the stimulus money has been spent? For that you want to look at “Cumulative”, and compare it with the final total for that column.
最後の質問は、経済刺激策はお金をどこまで使っているのか?
“Cumulative”をみれば分かる。 このコラムで、現時点の総額と最終総額を比較しておく。
Now the point is that “Rate”, in real life, follows an inverted U. The peak effect on the level of GDP comes at the top of the curve, but the peak effect on growth comes earlier, before the curve flattens out. In the table above, spending peaks in the second quarter of 2010, but the peak impact on growth is in the third quarter of 2009, i.e., it’s behind us. That’s true even though by the end of 2009 less than a third of the money has been spent.
実生活では、“Rate”(消費量)は、逆U字型になることが重要である。そのピークは、GDPがカーブの頂点に達する時期に影響するが、カーブが平らになる前に、そのGDP成長のピークは過ぎてしまった。上のテーブルでは、経済刺激策の消費ピークは、2010年第2四半期になっているが、そのGDP成長へのインパクトは、2009年の第3四半期である。つまり、もう過ぎてしまったということだ。
また、2009年第3四半期までに資金の3分の1は、使い果たしてしまったことも事実である。
And when the spending begins to tail off, the effect on growth turns negative.
経済刺激策が尽きたら、GDP成長への効果は後退するだろう。
What does this really look like? Menzie gives us the chart from Deutsche Bank, which is similar to other estimates, e.g. from Goldman Sachs:
このことを本当にどう思う? ドイツバンクのリサーチによるチャートでも指し示している。
同じような予測は、例えばゴールドマン・サックスなどでもしている。

You can see why I and many others are worried about the second half of next year.
なぜ、私も含め多くの人が来年の後半を心配しているか分かるでしょ。
1224 Job prospects
December 24, 2009, 1:57 pm
Job prospects
雇用予想
Mark Thoma has a nice chart relating excess capacity in manufacturing to unemployment: マーク・トーマスが、手工業の失業率における余剰能力のイカしたチャートを出している。

This offers a slightly different take on an issue I’ve been worrying about for a long time: recoveries don’t seem to be what they used to be.
このチャートは、私が長いこと心配していた問題を別の側面から言及している。つまり、景気が回復しても以前のようには戻らないだろうということだ。
Mark points out that in pre-90s recessions, rising capacity utilization — which coincides with the official end of the recession — was also marked by falling unemployment, right away. Since then, however, unemployment has seemed to follow the turnaround in capacity utilization only with a long lag.
マークは、90年代以前の不景気では、設備稼働率を上げることが、景気後退の終焉と一致しており、そのことが失業率の急激な回復にもなっていた。と指摘している。
Why the change? I argued in the piece above that it reflects, at least in part, a change in the nature of recessions. Here’s a somewhat better chart than the one I originally used:
違いは何でだ? 私は、少なくともある部分では、景気後退の性質の変化によるものだと主張していた。 私が利用していたものより、もっと優れたチャートがあった。

What this shows (you have to squint a bit) is that earlier recessions were preceded by sharp rises in interest rates, as the Fed tried to choke off inflation. This produced a housing slump, with a lot of pent-up demand; when the Fed decided that we had suffered enough, it relented, and both housing and the economy sprang back.
このチャートは、以前の景気後退は、Fedがインフレを抑えるような時に行う金利の急上昇により牽引されたことを示している。このことが、多くの繰延需要を抱えて、住宅販売不振を生み出した。
つまり、Fedが十分に耐えてと判断した時には、金利を緩めて、住宅と経済が回復した。
But later recessions took place in a low-inflation environment, in which booms died natural deaths from overextended credit and overbuilding. Getting the economy growing fast enough to bring unemployment down after these recessions was therefore much harder, since the usual channel of monetary policy — housing — lacked any pent-up demand.
しかし、今日の景気後退では、低インフレ環境に取って代わった。そのような低インフレでは、過剰な金融や建設の状況では、そのような急上昇は消え失せた。
通常の貨幣政策や住宅政策では、抑え込まれた需要の観点が欠けているため、景気後退が一層深刻になった後では、失業率が回復できるほどの経済成長が起きていた。
So what about our current situation? It’s just like the two previous “postmodern” recessions, only more so, since the bubble before the slump was in housing itself. This suggests a long period of jobless growth; so does the international evidence on the aftermath of financial crises.
では、現状はどうだろうか?現状は、”近代以前”の景気後退というよりは、景気後退が住宅の問題だけであった以前のバブルに近いと言えるだろう。このことは、長期間の雇用を産み出せない経済成長であることを意味している。
That said, there’s been a lot of optimism out there lately, reflected in the steepening yield curve. I’d like to think that’s right. But Ed McKelvey at Goldman (no link) has a new report titled “Recovery more Ho-Hum than Ho-ho-ho”, in which he acknowledges that growth will be good this quarter, but presents evidence that it’s all a temporary inventory bounce.
最近、険しいイールドカーブを反映した楽観主義が蔓延っている。それが正しいことであって欲しい。しかし、ゴールドマンサックスのエド・マッケルヴィーは、”Recovery more Ho-Hum than Ho-ho-ho”という新しいレポートを出した。その中で、彼は経済成長は、四半期では良いと認識しているが、それは一時的な在庫処分であるという証拠を出している。
(補足)
エド氏は、今回の景気回復は、L字型になるだろうと予想している。クルーグマンも同じ。
(補足)
エド氏は、今回の景気回復は、L字型になるだろうと予想している。クルーグマンも同じ。
We’re not out of this, by a long shot.
我々は、全然、この状況を脱していない。
1122 Role reversal
November 22, 2009, 5:49 am
Role reversal
役割交代
Many people on Wall Street are now warning that there’s a huge bubble in government debt, that interest rates will spike any day now; it’s a warning that clearly has the Obama administration’s ear. A good sample is this piece from Morgan Stanley, according to which “Our US economics team expects bond yields to rise to 5.5% by the end of 2010 - an increase of 220bp that outstrips the 137bp increase in the fed funds rate expected over the same horizon.”
ウォールストリートの多くの人が政府債務残高が巨大なバブルとなっているため、金利が急上昇すると警告している。この警告は、オバマ大統領の耳にも届いている。良い例がモルガンスタンレーのこの記事である。
”US経済担当チームによると債券金利は、2010年下期までに5.5%にあがる。同じ水準であったFFレート137bpを追い越して220bpの増加となるだろう。”
Role reversal
役割交代
Many people on Wall Street are now warning that there’s a huge bubble in government debt, that interest rates will spike any day now; it’s a warning that clearly has the Obama administration’s ear. A good sample is this piece from Morgan Stanley, according to which “Our US economics team expects bond yields to rise to 5.5% by the end of 2010 - an increase of 220bp that outstrips the 137bp increase in the fed funds rate expected over the same horizon.”
ウォールストリートの多くの人が政府債務残高が巨大なバブルとなっているため、金利が急上昇すると警告している。この警告は、オバマ大統領の耳にも届いている。良い例がモルガンスタンレーのこの記事である。
”US経済担当チームによると債券金利は、2010年下期までに5.5%にあがる。同じ水準であったFFレート137bpを追い越して220bpの増加となるだろう。”
登録:
投稿 (Atom)
